Good CLS
The target at the 75th percentile of page visits, evaluated separately for mobile and desktop.
Core Web Vitals · Debugging guide · AI-assisted workflow
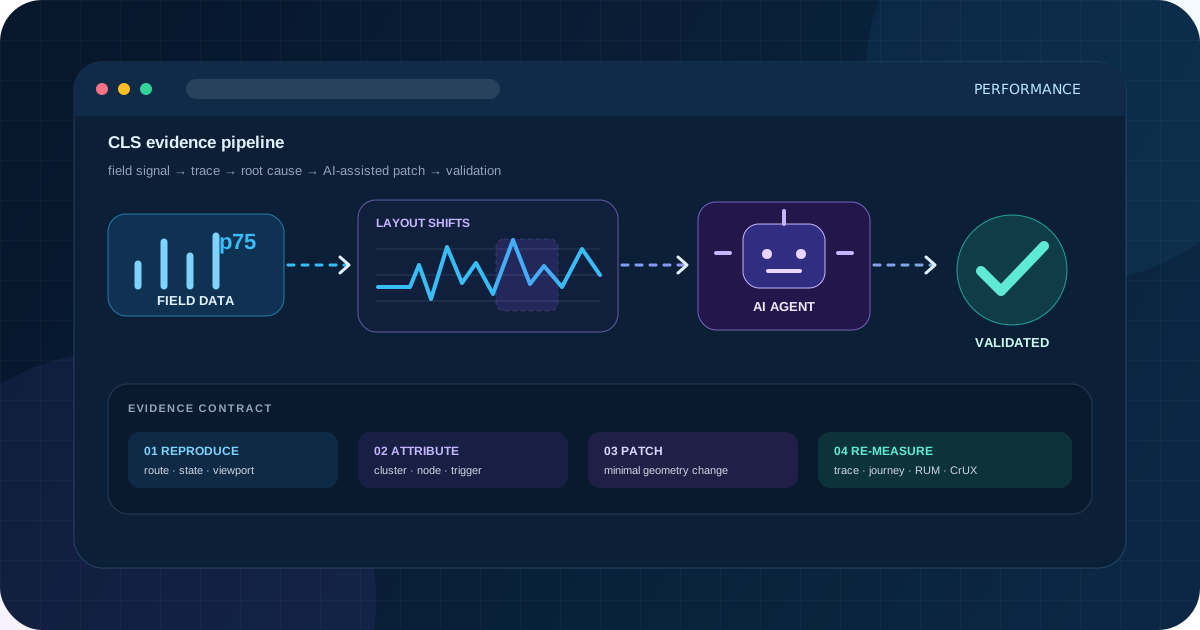
My rule is simple: do not ask an AI agent to “fix CLS” until you can name the affected page group, the largest shift cluster and the event that triggered it. The agent should accelerate evidence collection and testing—not replace the browser evidence.
The short answer
Start with field data, not CSS. Segment the failing URL group, reproduce both load and post-load shifts, record a Performance trace, inspect the largest Layout shifts cluster, and distinguish the moved element from the event that caused it. Use an AI agent only after this evidence exists; accept the patch only when the same trace, user journey and RUM segment improve.
The target at the 75th percentile of page visits, evaluated separately for mobile and desktop.
A field score above this boundary is classified as poor rather than “needs improvement”.
Consecutive shifts belong to one burst when each is less than one second after the previous shift, with a five-second cap.
CrUX field data is a rolling aggregate updated daily; a release does not replace the window overnight.
01 · Metric before tooling
CLS is a field-oriented stability metric, not a visual opinion and not a count of elements that moved.
Cumulative Layout Shift combines the affected viewport area with the distance that unstable content moved. The result is unitless. A score of 0.18 does not mean 180 milliseconds or 18 pixels; it represents the severity of the worst burst of unexpected shifts during the page visit. It measures visual stability, not loading speed as a whole.
For a good user experience, Google’s published guidance is CLS of 0.10 or less at the 75th percentile, evaluated separately for mobile and desktop. Values above 0.25 are poor. These are documented thresholds. A team’s internal goal—such as “keep every template below 0.05”—can be a useful engineering budget, but it should be labelled as an internal target rather than a Google rule.
CLS uses session windows, often described as shift clusters or bursts. Unexpected layout shifts are grouped when each shift occurs less than one second after the previous one, and the total window lasts no more than five seconds. The page’s CLS is the largest cluster score, not necessarily the sum of every shift over a long-lived session.
An AI model can describe what is visible in one frame. It cannot recover a missing network delay, an ad auction, a font swap or a route transition that occurred before the screenshot unless you provide the trace and runtime context. That is why the workflow in this guide moves from field signal to trace before it moves to code.
02 · Field signal
The field report tells you where the problem exists. DevTools tells you why a reproducible instance exists.
Open Search Console → Experience → Core Web Vitals, choose Mobile or Desktop, then open the relevant CLS issue. Search Console groups similar URLs and reports real-user data. It is a pattern detector, not a reliable lookup table for an arbitrary single URL: only indexed URLs with enough data appear, and the listed examples represent a wider URL group.
Save the status, device class, metric, group population and example URLs. Map each example to a page template, route type, experiment or component set.
PathSearch Console → Experience → Core Web Vitals → Mobile or Desktop → Open report → CLS issue
Pass criterionYou can state which template or journey is failing and which traffic segment the report represents.
Run a representative URL in PageSpeed Insights. In “Discover what your real users are experiencing”, verify whether the result is for the exact URL or the origin fallback. Do not attribute an origin-level CLS value to one page without qualification.
PathPageSpeed Insights → Discover what your real users are experiencing → This URL / Origin
Pass criterionThe report scope—URL or origin—is written next to the baseline.
Use RUM or the CrUX API to separate phone and desktop, route template, release, navigation type, country, experiment and logged-in state. Search Console combines many of these conditions.
PathCrUX API → queryRecord or your RUM dashboard → CLS p75 by template and release
Pass criterionAt least one segment has enough data to explain where the regression concentrates.
Save the exact query, time window and population. CrUX is a rolling 28-day aggregate updated daily, so compare aligned windows instead of expecting the field score to reset immediately after deployment.
Pass criterionThe baseline includes collection dates, device class, p75 and sample size or session count.
| Observed signal | Likely explanation | Next test |
|---|---|---|
| Field poor; reload trace poor | A load-time shift is reproducible. | Record the same URL with cache disabled and inspect the largest Layout shifts cluster. |
| Field poor; reload trace good | Post-load, personalized, geographic, ad, experiment or cache-state behavior is missing locally. | Record the real user journey; reproduce on the affected device/state; inspect RUM attribution. |
| URL field data absent; origin poor | The exact URL lacks enough CrUX data and the origin fallback is broader. | Use a representative template group or first-party RUM; do not call the page itself poor without evidence. |
| Search Console group poor; one example good | The example is representative of a group, not proof that every listed page fails now. | Sample multiple URLs from the group and segment by template/release. |
Custom diagram
A debugging path that refuses to jump from a red field score straight to a CSS patch.
03 · Browser evidence
A reliable reproduction is more valuable than a long list of generic CLS recommendations.
Open Chrome DevTools and select Performance. The live metrics view shows local CLS while you interact with the page. Use it first: scroll, open navigation, accept or reject consent, change routes, trigger lazy content and wait for delayed modules. The goal is to identify the shortest journey that changes the score.
Set the viewport and throttling to match the failing segment. Then record a navigation rather than clicking reload outside the panel.
PathDevTools → Performance → Environment settings → CPU / Network → Record and reload
Pass criterionThe trace records the full navigation and the local CLS shown in the trace is repeatable within an agreed tolerance.
Start recording without reload and execute the minimum sequence that produces the shift: scroll to the ad, open the drawer, change route, reveal validation errors or wait for the widget.
PathDevTools → Performance → Record → perform journey → Stop
Pass criterionA second trace contains the post-load shift and names the exact user action or wait condition.
Open the Rendering panel, enable Layout Shift Regions and repeat the journey. Purple regions show which visible areas moved, but they do not prove the root cause.
PathDevTools → More options → More tools → Rendering → Layout Shift Regions
Pass criterionYou can point to the moment and region of the shift without treating the highlighted node as the cause.
Use an empty cache, a slower connection, a narrower viewport, a first visit, a returning visit and the relevant consent or authentication state. One fast desktop reload is not a representative cumulative layout shift test.
Pass criterionThe test matrix includes the device/state where field data is poor, or the inability to reproduce is documented as a finding.
let runningCls = 0;

const observer = new PerformanceObserver((list) => {
  for (const entry of list.getEntries()) {
    if (entry.hadRecentInput) continue;

    runningCls += entry.value;
    console.group(`Layout shift ${entry.value.toFixed(4)} · CLS ${runningCls.toFixed(4)}`);
    console.log('Start time:', Math.round(entry.startTime), 'ms');
    console.table(
      entry.sources?.map(({ node, previousRect, currentRect }) => ({
        node,
        previous: `${previousRect.x},${previousRect.y} ${previousRect.width}×${previousRect.height}`,
        current: `${currentRect.x},${currentRect.y} ${currentRect.width}×${currentRect.height}`,
      })) ?? []
    );
    console.groupEnd();
  }
});

observer.observe({ type: 'layout-shift', buffered: true });
// Run observer.disconnect() when the debugging session is over.
Use this as a temporary debugging snippet in Chromium. It reports shifted nodes and coordinates; it is not a production CLS implementation and should be disconnected after the session.
04 · Root cause
The most common CLS debugging error is fixing the highlighted node instead of the earlier event that displaced it.
In the recorded trace, find the Layout shifts track. Purple diamonds represent individual shifts; the enclosing purple band represents a cluster. Start with the largest cluster, then select the largest diamond. The Summary view shows the shift score, timing and shifted elements, and can link to the Layout shift culprits insight.
Custom diagram
A heading can be reported as the shifted node even when an ad slot, banner or asynchronous component above it created the movement.
Record the selectors or component names, previous rectangles and current rectangles. This is the visible consequence.
PathPerformance trace → Layout shifts → select diamond → Summary → shifted elements
Pass criterionThe evidence table contains the nodes and their movement, not only the cluster score.
Inspect DOM mutations, style recalculation, layout work, network completions, font activity and script calls immediately before the shift. Pay special attention to the preceding element in document flow.
PathPerformance trace → Main / Network / Timings near the selected Layout Shift
Pass criterionAt least one earlier event explains why the geometry changed.
Disable the suspected widget, reserve its final space, force the fallback font, stop the animation or hold the route state constant. Change one variable.
Pass criterionThe cluster disappears or materially shrinks when the suspected trigger is removed, and returns when it is restored.
Write the hypothesis, affected template, trigger, evidence and expected change next to the ticket. This prevents an agent or developer from “fixing” a neighboring symptom.
Pass criterionAnother person can reproduce the same shift and understand why the proposed patch belongs to that component.
| Symptom in the trace | Likely trigger | Inspect here | Minimal fix | Verify |
|---|---|---|---|---|
| Content moves when an image appears | Missing intrinsic dimensions or unstable responsive ratio | Elements node, image request, computed size | Set correct width/height and responsive sizing; reserve the same aspect ratio | Reload with cache disabled at several viewports |
| Article jumps when ad or embed fills | Container starts at zero or changes between breakpoints | Slot DOM mutation, auction callback, iframe insertion | Reserve an honest min-height per breakpoint; collapse only before surrounding content is painted | Test fill, no-fill, refresh and consent states |
| Text reflows after font load | Fallback and web font metrics differ | Network font request, Rendering, computed fonts | Preload only critical fonts; use appropriate fallback and metric overrides; reduce font variants | Test cold cache and blocked-font fallback |
| Page moves after cookie choice | Banner inserted above content or removed from normal flow inconsistently | Consent script, DOM insertion, position rules | Use overlay or reserve a stable region; keep states geometrically consistent | Test first visit, accept, reject and revisit |
| SPA route shifts after hydration | Server and client render different geometry or late state changes component size | Main thread around hydration, framework component state | Align initial state; reserve skeleton geometry; delay noncritical insertion | Test hard navigation and route transition |
| Only experiments or personalized users fail | Variant markup changes height or insertion order | Experiment ID in RUM, response payload, DOM mutations | Set a common geometry contract across variants | Compare p75 by variant and release |
05 · Native AI agent
The built-in Gemini agent can select context, record traces, run audits and prepare a coding-agent prompt, but its output still needs an evidence contract.
Chrome DevTools now includes an experimental AI assistance panel powered by Gemini. Current documentation says the agent can work with performance, styling, network and sources; autonomously select context; run audits; record performance traces; show a step-by-step walkthrough; and generate a prompt for a coding agent. Autonomous actions, walkthroughs and prompt generation are documented for Chrome 149 and later.
Use the latest supported Chrome, sign in, confirm region and age requirements, then opt in. The feature is disabled by default.
PathDevTools → Settings → AI assistance
Pass criterionThe team has reviewed the terms, data policy and enterprise controls before using production context.
Use the global AI assistance button or open it from the Performance panel so the conversation starts with the relevant trace context.
PathDevTools toolbar → AI assistance, or Performance → Debug with AI
Pass criterionThe selected performance event or trace is visible as the conversation context.
Tell the agent to identify the largest cluster, list shifted nodes, cite the earlier trigger candidate and describe how to disprove each hypothesis. Reject a response that jumps directly to generic width/height advice.
Pass criterionEvery proposed fix references a trace event, DOM node, request or runtime observation.
When the agent proposes or executes code, inspect the step-by-step walkthrough and pause before any action that can change state. Use a reproducible staging page whenever possible.
Pass criterionNo change is accepted without a human-reviewed diff and a repeated trace.
Record a performance trace for this page and the journey I describe. Identify the largest Layout Shift cluster. For every shifted node, separate the visible victim from the earlier DOM, CSS, font, network or script event that triggered the movement. Cite the trace evidence, rank hypotheses, and do not propose code until each hypothesis has a falsification test.This prompt constrains the agent to evidence. Add the exact route, device, state and journey instead of asking “Why is my CLS bad?”
06 · Coding agents + MCP
The useful shift is not “AI writes CSS”; it is “the agent can observe the browser, change code and rerun the same acceptance test”.
Chrome DevTools for agents reached stable 1.0 on May 19, 2026. The official toolkit includes an MCP server, a command-line interface and agent skills. It can give a coding agent browser visibility, run Lighthouse audits, emulate devices and network or CPU conditions, and work with live runtime output rather than source code alone.
{
  "mcpServers": {
    "chrome-devtools": {
      "command": "npx",
      "args": ["-y", "chrome-devtools-mcp@latest"]
    }
  }
}
Use the configuration format required by your coding environment. Pin and review versions in controlled projects rather than depending forever on @latest.
For CLS work, the relevant MCP tools include starting and stopping a performance trace and analyzing the insights returned by a trace. The current tool reference exposes performance_start_trace, performance_stop_trace and performance_analyze_insight, alongside emulation and browser inspection tools.
Investigate CLS on the supplied staging URL. Do not edit source files yet.

1. Emulate a 390×844 viewport, Slow 4G and 4× CPU slowdown.
2. Record one reload trace and one trace of the supplied user journey.
3. Report the largest Layout Shift cluster and each contributing shift.
4. For every shifted node, identify the earlier DOM, CSS, font, network or script event that could have triggered it.
5. Separate observed evidence from hypotheses. Rank hypotheses and state how each can be falsified.
6. Propose one minimal patch only after the evidence table is complete.
7. Re-run the identical traces after the patch and compare CLS, cluster score and visual behavior.
8. Return the trace conditions, screenshots, changed files and remaining uncertainty.
The prompt deliberately separates investigation, patching and validation. Give the agent a staging URL, repository, exact journey and permitted files; do not give it an open-ended production brief.
Custom diagram
The agent sits inside the loop, but browser evidence enters before the model and independent validation happens after the model.
An emerging optional layer is third-party developer tooling that exposes framework state to agents. Chrome has demonstrated experimental integrations that can provide component or runtime details—useful when a shifted DOM node maps poorly to an Angular signal, dependency injection graph or another framework abstraction. Keep this behind an experimental flag and never make the article’s baseline workflow depend on it.
07 · Implementation
A good CLS fix establishes stable geometry before asynchronous content arrives; it does not hide every symptom with a fixed height.
The recurring pattern is simple: something arrives late and changes the space occupied in normal flow. The implementation should give the browser enough information to allocate the final geometry before that event. The exact mechanism differs for media, ads, fonts, consent, hydration and route transitions.
<article class="promo-card">
  <img
    src="/images/promo-800.webp"
    srcset="/images/promo-400.webp 400w, /images/promo-800.webp 800w"
    sizes="(max-width: 640px) 100vw, 400px"
    width="800"
    height="450"
    alt="Product preview"
  />
</article>

<div class="ad-slot" data-slot="leaderboard" aria-label="Advertisement"></div>
The width and height attributes establish an aspect ratio for the image. The ad slot uses a documented, breakpoint-specific space contract; choose values from real creative sizes rather than copying these example numbers.
.promo-card img {
  display: block;
  width: 100%;
  height: auto;
  aspect-ratio: 16 / 9;
  object-fit: cover;
}

.ad-slot {
  min-height: 250px;
  contain: layout paint;
}

@media (min-width: 768px) {
  .ad-slot { min-height: 90px; }
}
Do not use a permanent 250 px blank region if the component can never fill it. Model fill, no-fill and breakpoint states explicitly.
font-display: swap alone can trade invisible text for reflow.08 · Field attribution
RUM closes the gap when the bad shift depends on a user state or production condition you cannot reproduce locally.
The WICG Layout Instability API exposes layout-shift entries and source attribution in Chromium. The specification itself warns that the reported sources are shifted elements and may be only indirectly related to the true root cause. It is a Community Group Draft, so describe its status accurately and avoid building user-visible behavior around observer delivery timing.
For production measurement, the official web-vitals package tracks the current metric behavior and offers an attribution build. That build adds diagnostic fields and is roughly 1.5 KB larger when brotli-compressed, so load it when the attribution will actually be stored and used.
import { onCLS } from 'web-vitals/attribution';

onCLS((metric) => {
  const payload = {
    name: metric.name,
    value: metric.value,
    rating: metric.rating,
    metricId: metric.id,
    url: metric.navigationURL || location.href,
    navigationType: metric.navigationType,
    largestShiftTarget: metric.attribution.largestShiftTarget,
    largestShiftTime: metric.attribution.largestShiftTime,
    loadState: metric.attribution.loadState,
    release: window.__RELEASE_ID__,
  };

  navigator.sendBeacon('/rum/web-vitals', JSON.stringify(payload));
});
Sample traffic, strip or hash selectors that may contain user data, document retention, and avoid registering the metric functions repeatedly on the same page. Replace the endpoint and release identifier with your telemetry contract.
| Field | Why it matters | Example |
|---|---|---|
| Metric context | Prevents mixing unlike populations | CLS value, rating, metric ID, navigation type |
| Page context | Maps the event to a stable segment | Template ID, normalized route, locale, device class |
| Attribution | Provides the visible node and timing clue | Largest shift target, largest shift time, load state |
| Release context | Separates regressions from old traffic | Commit or release ID, experiment/variant ID |
| Privacy-safe state | Explains conditions without exposing identity | Consent state, logged-in boolean, country bucket |
| Evidence link | Lets a human inspect the original artifact | Trace ID, replay ID or screenshot reference |
09 · Acceptance
A green local trace is necessary evidence, but it is not the end of the cumulative layout shift fix.
Use the same viewport, throttling, cache state and journey. Compare the largest cluster, not only the final number.
Pass criterionThe trigger no longer creates the shift, and no new cluster appears elsewhere.
Cover first and repeat visit, consent states, ad fill/no-fill, authentication, locale, experiment and relevant breakpoints.
Pass criterionThe geometry contract holds in every supported state, not only the happy path.
Check that reserved space, overlays and skeletons do not obscure content, trap focus, change reading order or create large blank regions.
Pass criterionThe fix improves stability without a usability regression.
Compare CLS p75 and incident distribution for the affected template before and after the release. Keep the pre-release segment as the control.
Pass criterionThe target segment improves and the sample is large enough to make the comparison meaningful.
Track CrUX/Search Console as confirmation, not as an instant deployment test. The 28-day window changes gradually as new days replace old ones.
Pass criterionThe field trend moves in the expected direction without declaring victory from one daily update.
Store the trace conditions, selector or journey, budget and artifact link. A coding agent can rerun it on pull requests or releases, but a human should own threshold changes.
Pass criterionA future regression creates a reproducible incident with evidence, not a generic alert.
CLS is relevant to page experience, but fixing it does not guarantee a ranking increase. The practical reason to improve it is more direct: content stays where the user expects it to stay. Treat any SEO outcome as one result among many, not as the acceptance test for a browser bug.
Primary sources and documentation
Every changing search, browser, interface or technical-behavior claim in this guide is tied to a current primary source.
Need help diagnosing and implementing the fix?
We combine CrUX and RUM segmentation, Chrome traces, frontend diagnostics and evidence-led AI agents. The deliverable is not a list of generic recommendations; it is a root-cause record, implementation backlog and repeatable acceptance test.
Explore Core Web Vitals optimization