Core Web Vitals evaluation
Recommended thresholds are evaluated at the 75th percentile, segmented across mobile and desktop experiences.
Web Performance · Core Web Vitals · Measurement
CrUX, PageSpeed Insights, Lighthouse and RUM are not four competing ways to measure the same thing. I use field data to establish the user problem, then calibrate lab profiling to the affected audience, trace the cause, ship the smallest justified change and return to field data for validation.
The short answer
Start with field evidence, not with the Lighthouse score. I use CrUX as the public baseline for whether eligible real Chrome users have a Core Web Vitals problem, then use first-party RUM or analytics to understand the affected cohort. Lighthouse and local DevTools profiling are controlled debugging environments: configure them to approximate those users, reproduce the symptom, inspect the trace, and validate the change in production. A green lab run is useful evidence, but it is not a substitute for field data.
Recommended thresholds are evaluated at the 75th percentile, segmented across mobile and desktop experiences.
PSI field data and the CrUX API use a trailing 28-day collection period that is updated daily.
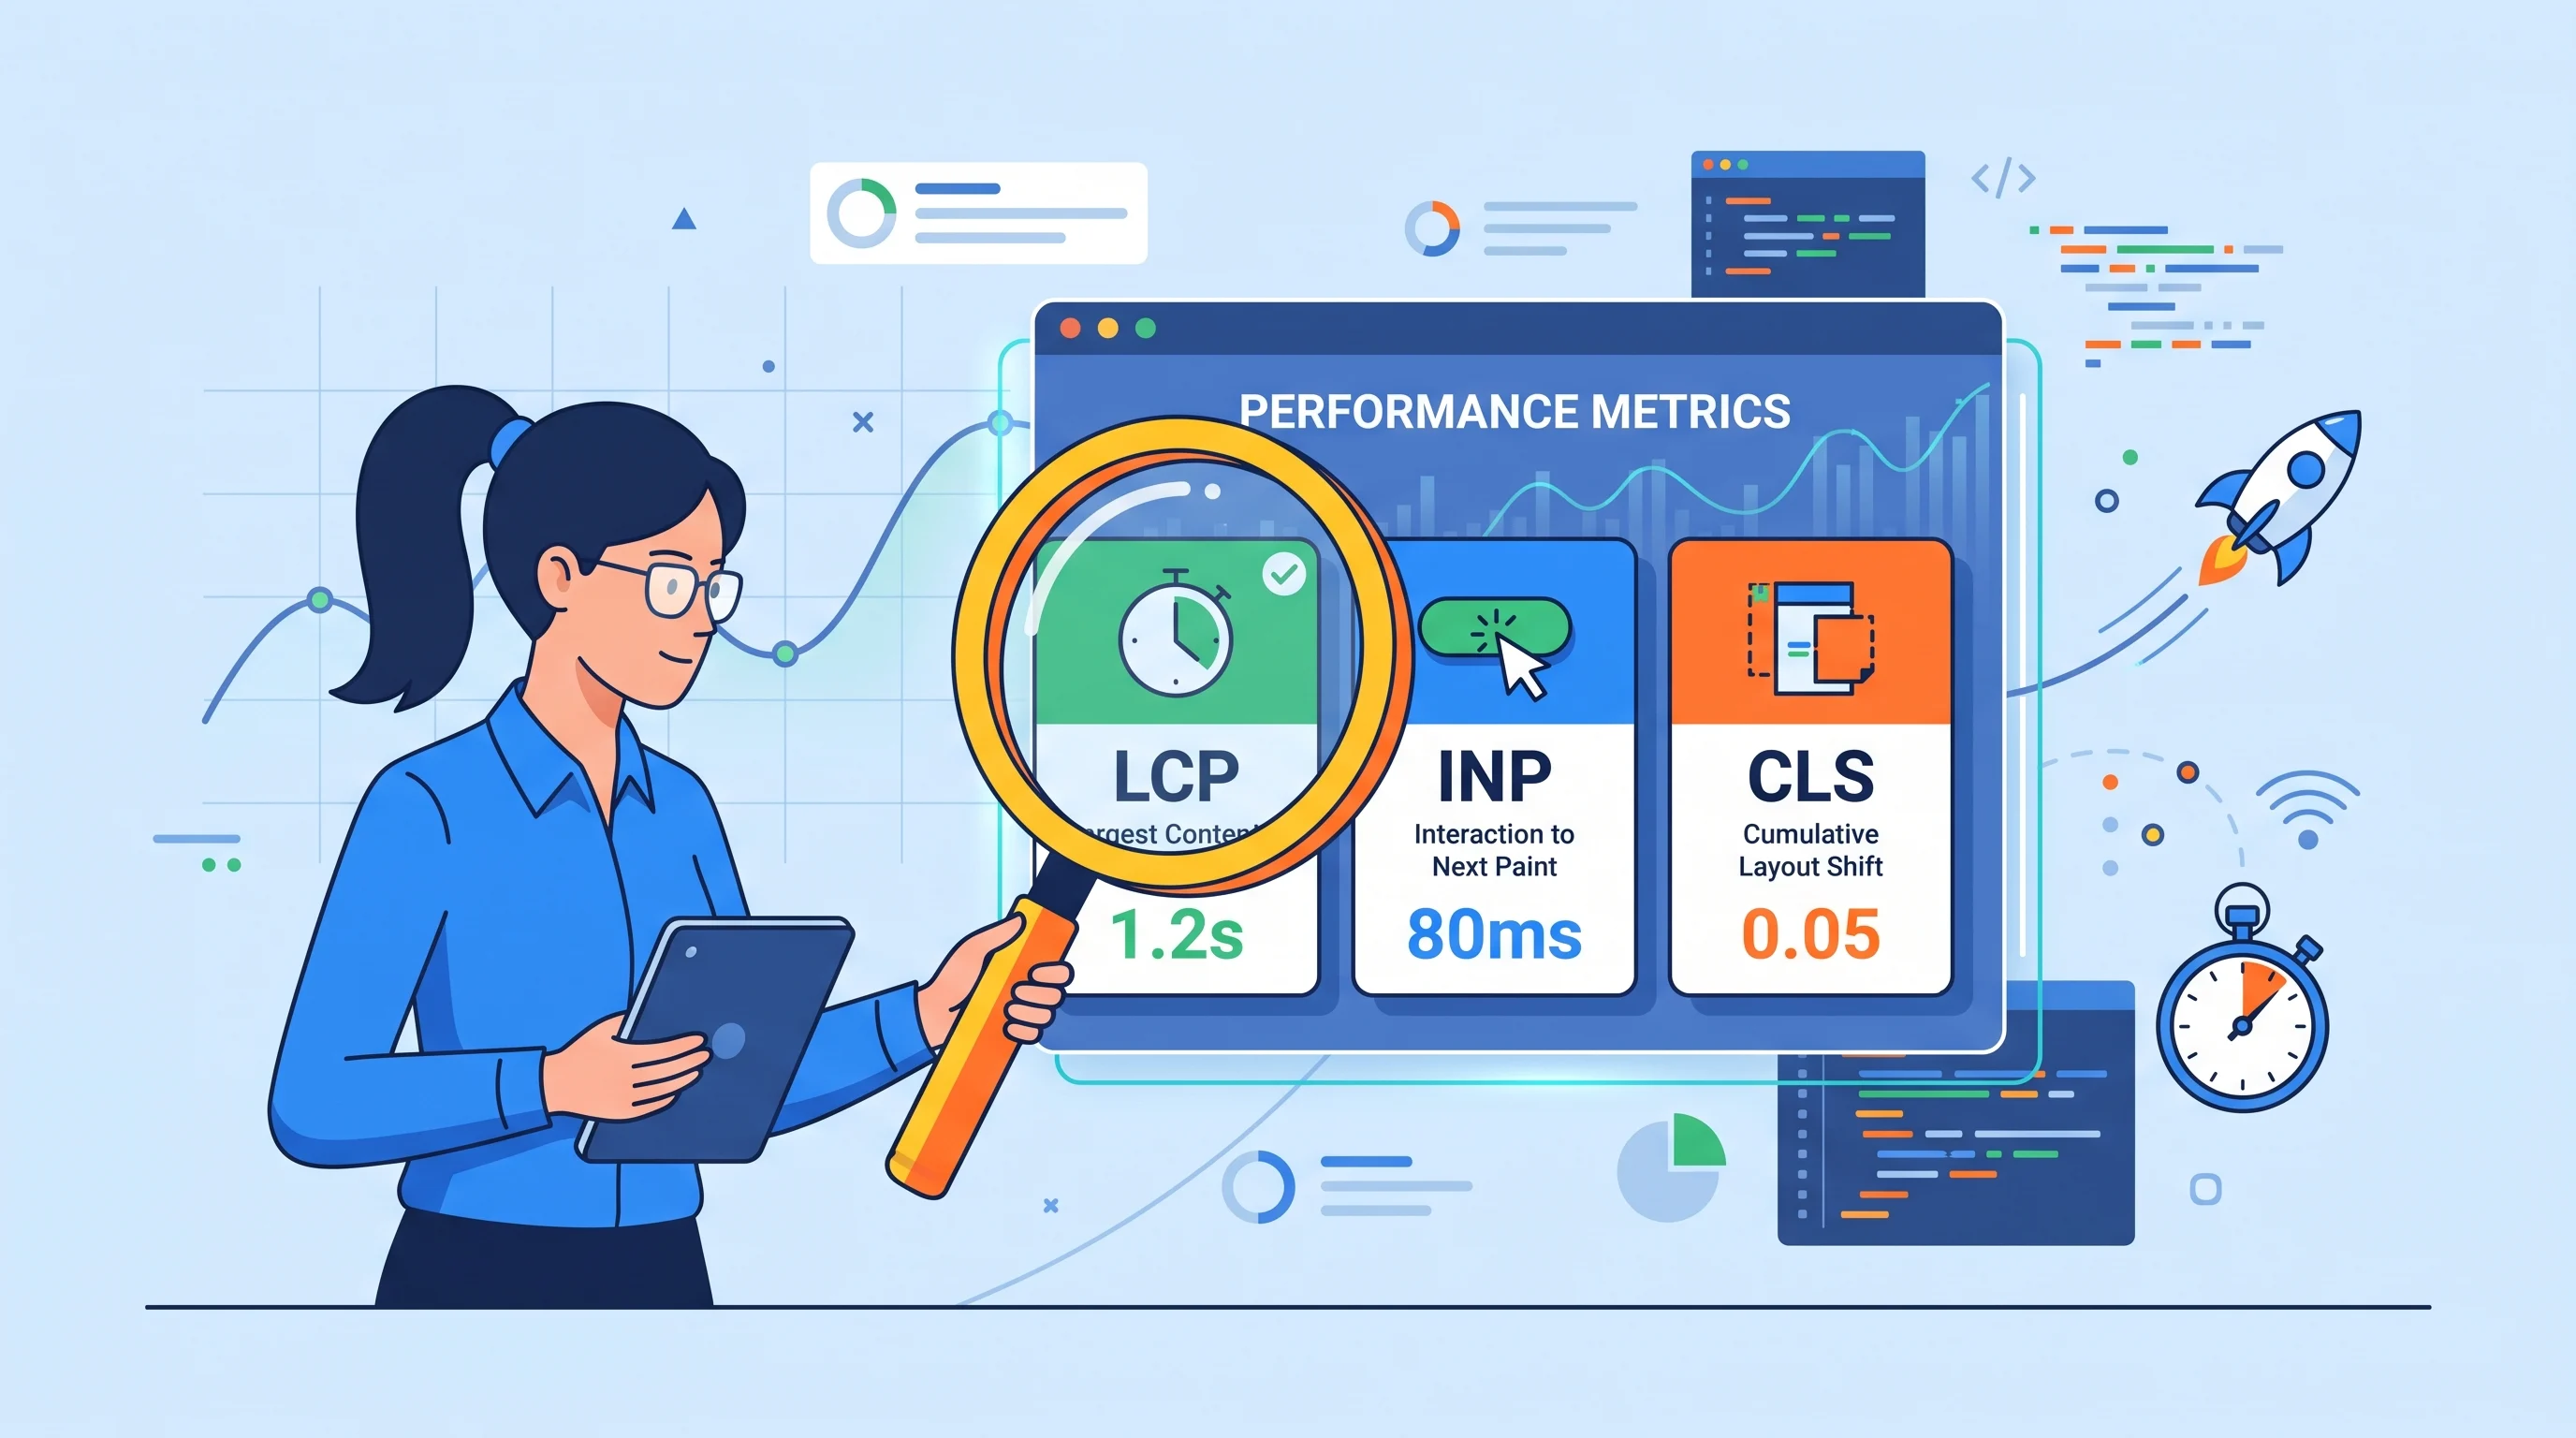
Current good thresholds for LCP, INP and CLS respectively.
CrUX exposes phone, tablet and desktop—not exact device models—so audience calibration needs additional first-party context.
Measurement model
The first decision is not which tool is best. It is which question you are trying to answer.
The mistake I see most often is putting a CrUX percentile, a PageSpeed Insights lab result, a local Lighthouse run and a RUM percentile into one mental bucket called the score. They describe different populations, time windows and levels of control. Field data tells you what users actually experienced; lab data gives you a controlled environment for reproduction and diagnosis. Google documents the same division: CrUX and PSI field data are real-user distributions, while Lighthouse is a simulated load designed for diagnostics.
| Source | What it represents | Best question | Main limitation |
|---|---|---|---|
| CrUX | Aggregated eligible Chrome user experiences; page or origin; rolling 28 days | Does a real-user problem exist, and on which form factor? | Public aggregate; Chrome-only eligible population; limited segmentation |
| PageSpeed Insights | CrUX field data plus a Lighthouse lab analysis in one interface | Can I inspect field status and get an immediate lab diagnostic from one URL? | The field and lab panels are different datasets and may legitimately disagree |
| Lighthouse / DevTools | One controlled or simulated test environment | Can I reproduce a symptom and inspect why it happens? | A run is not the distribution of your real users and can vary with conditions |
| First-party RUM | Measurements collected from visits to your own product | Which routes, cohorts, releases or environments are actually affected? | Implementation, consent, sampling and metric methodology become your responsibility |
Custom diagram
CrUX and RUM establish the production problem. PSI can surface both the field signal and a Lighthouse snapshot. Lighthouse and DevTools then turn that signal into a controlled experiment rather than replacing it.
Field baseline
A real-user number is only useful after you know exactly what population and aggregation it represents.
CrUX is where I start because it answers the most important first question: is the problem visible in real-user data? But I never copy the first number I see. PSI can show page-level CrUX when that URL has enough data, then fall back to origin-level data when it does not. Search Console goes one level further and groups similar URLs. Those are three different grains, and confusing them can send an investigation toward a page that was never actually measured on its own.
In PageSpeed Insights, verify whether the field panel is showing the requested URL or an origin fallback. Do not attribute an origin-wide p75 directly to one page.
PathPageSpeed Insights → Discover what your real users are experiencing → This URL / Origin
Pass criterionThe investigation notes state URL-level or origin-level explicitly.
Read the affected form factor separately. The Core Web Vitals target is evaluated at p75 by device category, and Search Console also separates Mobile and Desktop views.
PathPSI / CrUX → form factor · Search Console → Core Web Vitals → Mobile or Desktop
Pass criterionThe failing metric and p75 are recorded for the relevant form factor, not only as an all-device aggregate.
Save the first and last dates or at least the access date. A CrUX API or PSI field number represents a rolling 28-day period, not the performance of the current deployment alone.
Pass criterionThe baseline includes the measurement window and verification date.
Capture p75 together with the good / needs-improvement / poor distribution when available. A threshold classification hides how close the cohort is to a boundary.
Pass criterionThe evidence package preserves the percentile and distribution rather than only a green/amber/red label.
For reproducible checks, use the CrUX API with a specific URL or origin and formFactor. The API supports DESKTOP, PHONE and TABLET dimensions.
Pass criterionThe query target and form factor are explicit and repeatable.
| Surface | Granularity | Time behavior | Use it for |
|---|---|---|---|
| PSI field panel | Page when eligible; otherwise origin fallback | Trailing 28 days, updated daily | Fast URL investigation—but verify the shown grain |
| CrUX API | Page or origin; optional form factor | Trailing 28 days, updated daily | Reproducible queries and automation |
| CrUX History API / CrUX Vis | Page or origin; form factor | 40 weekly points, each based on a 28-day collection period | Trend context without pretending each point is an independent week |
| Search Console Core Web Vitals | Groups of similar URLs; Mobile / Desktop | 28-day field measurements surfaced as issue groups | Prioritize site-wide cohorts rather than diagnose one exact URL |
PSI interpretation
The field panel and the Lighthouse panel are adjacent in the UI, but they are not observations from the same run.
PageSpeed Insights is useful precisely because it places two evidence layers together: the top field section is CrUX over the previous 28 days, while the lab diagnostics are produced by Lighthouse in a simulated environment. That convenience also creates a common interpretation bug: people compare a field p75 LCP with the current Lighthouse LCP as if one should reproduce the other exactly. It should not. One is a historical distribution across many real-user conditions; the other is a controlled single test.
Custom diagram
The PSI interface can show a CrUX distribution and a Lighthouse diagnostic for the same requested URL, but their populations and time horizons differ.
Lab variability
Repeated lab runs are samples from a test environment. They become evidence only when that environment is controlled and recorded.
In day-to-day profiling, I routinely expect repeated Lighthouse runs to move. A simple illustrative sequence is LCP 2.0 s → 4.0 s → 3.5 s on the same page without a code change. Those values are not client measurements; they illustrate why I never choose the fastest run and call the page fixed. Google lists network routing, different hardware, browser extensions, antivirus and other resource contention among common variability sources. PageSpeed Insights also notes that local network availability, client hardware and client resource contention can change results.
| Run | LCP | What it proves |
|---|---|---|
| 1 | 2.0 s | Only that this test execution produced a good LCP under its conditions |
| 2 | 4.0 s | The test environment or page behavior is variable enough to change the conclusion |
| 3 | 3.5 s | A single best run is not a stable baseline; investigate spread and conditions |
Use the same route, build, feature flags, consent state and user journey. If ads or experiments are nondeterministic, record that as a limitation or control them in a dedicated test environment.
Pass criterionEach run starts from the same documented application state.
Use a clean browser profile without extensions where possible and close heavy local workloads that compete for CPU, memory or network resources.
Pass criterionThe machine and browser state are stable enough that obvious local contention is not changing between runs.
Do not mix cold-load and warm-cache runs in one comparison. Use the state that matches the question and keep it consistent across baseline and candidate build.
Pass criterionEvery compared run uses the same cache/storage rule.
Use one documented throttling profile for a comparison. The profile should approximate the affected audience rather than whichever preset happens to be convenient.
Pass criterionCPU and network settings are recorded with the result.
For this workflow, my recommendation is five equivalent runs when time permits. Keep every result, use the median as the compact summary and inspect the spread instead of discarding inconvenient runs. Five is a practical comparison protocol for this guide, not a Google threshold or a claim about an official standard.
Pass criterionBaseline and candidate have the same run count, conditions, median and visible spread.
The outlier is often diagnostically useful. If one run regresses, inspect the Performance trace and network activity rather than averaging the symptom away.
PathChrome DevTools → Performance → Record and reload / Record
Pass criterionAt least the representative slow trace can be tied to a concrete loading, scripting or rendering mechanism.
Audience calibration
A reproducible lab is useful; a reproducible lab that resembles the affected cohort is much more useful.
My normal sequence is field baseline → audience profile → local reproduction. I first determine whether the problem is primarily mobile or desktop in CrUX. Then I use first-party analytics or RUM to understand what those visitors actually use: browser mix, viewport/device class, route, geography or release cohort where available and privacy-safe. Only then do I choose CPU and network constraints. 4G is an example, not a universal preset. If it does not approximate your affected users, it is the wrong model for the investigation.
Start with the CrUX or Search Console device category and metric that is actually failing at p75.
Pass criterionYou can name the field cohort and the metric before opening DevTools.
Use your analytics/RUM to learn which route types, screen/device classes, browsers or releases dominate the affected traffic. Do not assume CrUX can tell you an exact phone model; its public form-factor dimension is only phone, tablet or desktop.
Pass criterionThe local profile is justified by first-party audience evidence, not a generic device persona.
Enable CrUX Field metrics in Chrome DevTools Performance. The Live Metrics screen can show local metrics next to field metrics and its environment settings can recommend device, CPU and network throttling based on CrUX data.
PathChrome DevTools → Performance → Live metrics → Field metrics / Environment settings
Pass criterionLocal and field context are visible and the chosen environment is documented.
DevTools can calibrate custom CPU throttling presets for low- and mid-tier mobile approximation, but the slowdown is relative to your own computer. Chrome explicitly notes that a desktop CPU cannot truly simulate a mobile CPU architecture.
PathPerformance → Capture settings → CPU → Calibrate
Pass criterionThe report records the host machine and selected/calibrated CPU slowdown instead of calling it an exact device simulation.
For LCP, test the navigation state that produces the slow load. For INP and CLS, include the interactions or post-load behavior implicated by field data or RUM. A load-only Lighthouse audit cannot expose every interaction-driven issue.
Pass criterionThe test journey can trigger the same class of symptom that motivated the investigation.
First-party field data
CrUX is an excellent public baseline, but first-party RUM can expose the cohorts and release context needed to act.
CrUX is not a census of every visitor. Its current eligibility rules include supported Chrome platforms and opted-in users; Chrome on iOS, Android WebView and other Chromium browsers such as Edge do not contribute. A trustworthy RUM implementation can therefore answer questions CrUX cannot: which route template regressed after release X, whether a browser cohort is worse, whether signed-in journeys differ, or which element is associated with a poor metric. That does not make RUM automatically more correct—its own consent, sampling and implementation choices can change the population too.
| Dimension | CrUX | First-party RUM |
|---|---|---|
| Population | Eligible Chrome experiences under CrUX methodology | Visitors your implementation is permitted and able to measure |
| Time window | Fixed rolling 28-day view in common CrUX surfaces | Can be release-, day- or cohort-specific if sample size supports it |
| Device detail | Phone / tablet / desktop public form factor | Can add privacy-safe device, viewport or browser cohorts you control |
| Route / release context | Page/origin aggregates; Search Console URL groups | Can attach normalized route templates, build/release IDs and journeys |
| Debug attribution | Limited public aggregates | Can collect targeted LCP/INP/CLS attribution with suitable instrumentation |
import {onCLS, onINP, onLCP} from 'web-vitals/attribution';

function sendWebVital(metric) {
  const attribution = metric.attribution || {};
  const target =
    metric.name === 'LCP' ? attribution.target :
    metric.name === 'INP' ? attribution.interactionTarget :
    metric.name === 'CLS' ? attribution.largestShiftTarget :
    null;

  const payload = {
    name: metric.name,
    value: metric.value,
    rating: metric.rating,
    id: metric.id,
    path: location.pathname,
    target: target || null
  };

  navigator.sendBeacon(
    '/rum/web-vitals',
    new Blob([JSON.stringify(payload)], {type: 'application/json'})
  );
}

onLCP(sendWebVital);
onINP(sendWebVital);
onCLS(sendWebVital);
Syntax checked on 2026-09-08. Requires the web-vitals package and a site-specific /rum/web-vitals endpoint. Keep the payload intentionally small; normalize routes and remove identifiers or sensitive data before collection.
Metricum Lab method
The measurement chain should make every transition explicit: what was observed, what is hypothesized, how it is reproduced and how the release will be validated.
I use CrUX as the first public baseline, not the final diagnostic. Once the field signal is clear, I identify the affected audience, make the lab look enough like that audience to reproduce the symptom, capture a trace, test one falsifiable explanation at a time, and then go back to production. This ordering prevents two common failures: optimizing a Lighthouse number that no user cohort actually has, and shipping a plausible fix that was never connected to the field regression.
Custom diagram
Each lab action is anchored to a production signal, and every release returns to production measurement rather than ending at a synthetic score.
Record CrUX p75, distribution, grain, form factor and collection window for the failing metric.
Pass criterionThe problem statement can be written without mentioning Lighthouse.
Use RUM/analytics when available to narrow route, browser, viewport/device class, geography or release differences that CrUX cannot expose publicly.
Pass criterionThe hypothesis names a cohort rather than an abstract average user.
Configure the browser environment to approximate that cohort and execute the same navigation or interaction journey repeatedly.
Pass criterionThe symptom appears often enough that a trace can be captured under documented conditions.
Use the Performance panel to connect the metric to network, main-thread, rendering or layout evidence. Separate the observed trace from the hypothesis about root cause.
Pass criterionA proposed change points to an observed mechanism in the representative trace.
Prefer the smallest change that can falsify or support the current hypothesis. Avoid broad bundles of performance edits that make attribution impossible.
Pass criterionThere is a clear before/after expectation for the same controlled test.
After release, compare the affected cohort against the baseline with the same metric definition and enough samples. Watch for regressions in the other Core Web Vitals as well.
Pass criterionThe production distribution moves in the expected direction without a material new regression.
Use CrUX/History data as slower public confirmation. Because common CrUX surfaces use a rolling 28-day window, a real release improvement should not be expected to replace the whole field distribution the next morning.
Pass criterionThe longer-window field trend becomes consistent with the production RUM result, or the remaining disagreement is investigated.
Decision support
Disagreement is not a reason to pick your favorite tool. It is evidence that population, grain, timing or environment differs.
| Observed pattern | Most likely interpretation | Next action |
|---|---|---|
| CrUX poor · Lighthouse good | Your lab did not reproduce the affected field conditions or journey | Check URL vs origin, form factor, RUM cohorts, throttling and interaction path; then trace a representative case |
| CrUX good · Lighthouse poor | The constrained lab case may be rarer or harsher than the current field p75 | Keep the lab issue if it exposes meaningful risk, but do not report it as a current field failure |
| PSI shows origin data · one URL looks poor | The field number belongs to the origin aggregate, not necessarily that URL | Query URL-level CrUX if eligible or use RUM before assigning root cause to the page |
| RUM poor · CrUX good | The measured populations or metric implementations differ, or the issue is concentrated in a cohort CrUX smooths out | Align Chrome-only / device / 28-day comparisons first; then audit RUM instrumentation and cohort mix |
| Search Console group poor · sampled URL good | A URL group can contain similar pages with a shared status while one example is an outlier | Investigate the template/cohort and additional group members rather than treating one URL test as a group verdict |
| Lighthouse baseline and candidate overlap heavily | The apparent change is smaller than test variability | Increase control/repetition, inspect traces and do not claim improvement from the best individual run |
For CLS specifically, lab/field gaps are especially common when shifts happen after user interaction. The same principle is covered in the Metricum Lab CLS debugging guide: reproduce the user journey, capture evidence and validate in the field instead of stopping at a load-only audit.
Release gate
A fix is complete when the mechanism improves under controlled conditions and the affected production distribution moves in the same direction.
The lab is where I want fast feedback. The field is where I want the final verdict. A strong performance change should survive both: the same controlled test should improve for an explainable reason, then the production cohort should move after release. CrUX is deliberately slower because its common views are 28-day rolling aggregates, so I use RUM for earlier release feedback and CrUX for durable public confirmation.
Repeat the same lab contract on baseline and candidate build; compare median, spread and traces rather than one best run.
Pass criterionThe candidate improves under equivalent conditions and the mechanism is visible in trace evidence.
Check LCP, INP and CLS together. A change that improves one metric by materially worsening another is not a clean win.
Pass criterionNo new material regression appears in the other Core Web Vitals.
Compare the same route/device/browser/release cohort and metric definition after enough real-user samples accumulate.
Pass criterionThe field distribution shifts in the expected direction with sufficient sample context.
Track PSI/CrUX or the History API without expecting an overnight reset. Historical weekly points still represent overlapping 28-day collection periods.
Pass criterionThe longer public field trend confirms the improvement or identifies a remaining cohort mismatch.
Store the field baseline, environment contract, representative traces, code change, release ID and post-release field comparison. This turns the fix into a regression test rather than a one-off success.
Pass criterionA future regression can be compared against the same evidence chain.
The practical principle is simple: use CrUX to decide whether you have a real-user problem; use RUM to understand who has it; use Lighthouse and DevTools to reproduce and explain it; then return to field data to prove the change worked. If the issue is visual instability, continue with the CLS debugging workflow. The same field-first logic will also underpin our LCP diagnosis workflow.
Primary sources and documentation
Every changing search, browser, interface or technical-behavior claim in this guide is tied to a current primary source.
Need help diagnosing and implementing the fix?
Metricum Lab can connect CrUX and first-party field signals to controlled browser traces, implementation hypotheses and post-release validation—without optimizing for a Lighthouse number in isolation.
Explore Core Web Vitals Optimization